
Internal Rate of Return in Real Estate Explained


IRR, or internal rate of return, is the annualized, time-weighted return on the equity you put into a deal, calculated across every cash flow from day one through the final sale. It is the single most complete return metric for hold-period analysis because it captures operating income, appreciation, and debt paydown in one number. Use it to compare deals with different cash-flow timing, to weigh levered against unlevered structures, and to screen any opportunity against your personal hurdle rate.
Where IRR is most useful:
Comparing two deals with different hold periods or uneven distributions
Evaluating levered versus unlevered structures on the same property
Screening against a hurdle rate before committing to a full underwrite
Where to pair it with other metrics:
Use MOIC (equity multiple) when total dollars returned matter as much as rate
Use cash-on-cash return to check annual yield during the hold
Use cap rate to benchmark first-year unleveraged income
Microsoft Excel’s XIRR function and Google Sheets’ equivalent are the standard tools for computing IRR on real-world cash flows. As JPMorgan notes, IRR indicates the annualized rate of return a project is expected to generate, accounting for the time value of money. At 2ndstreetpropertymanagement, we apply this framework every time we help investors evaluate Southern New Jersey rental opportunities.
Table of Contents
What does IRR actually mean for a real estate investor?
IRR is the discount rate that sets the net present value (NPV) of all your cash flows to zero. In plain English: it is the compound annual growth rate your equity earns over the hold period, given every dollar in and every dollar out. IRR captures the full picture from acquisition to disposition, unlike cap rate, which measures only first-year unleveraged yield.

The time-value-of-money concept is at the core of why IRR matters. A dollar received today is worth more than a dollar received three years from now, because today’s dollar can be reinvested. IRR forces you to account for that difference, which simpler metrics ignore entirely.
Three quick comparisons:
IRR vs. ROI: ROI divides total profit by total cost with no regard for timing. A deal that doubles your money in two years and one that doubles it in ten years show the same ROI but very different IRRs.
IRR vs. cap rate: Cap rate is a first-year snapshot of unleveraged income yield. IRR spans the entire hold, including appreciation and debt paydown, making it far more useful for comparing rental property options over time.
IRR vs. cash-on-cash: Cash-on-cash measures your annual cash yield on invested equity in a single year. IRR annualizes the full return stream, including the exit.
One important flag: IRR is pre-tax and depends heavily on your exit assumptions. Change your projected sale price by 10%, and your IRR can shift by several percentage points.
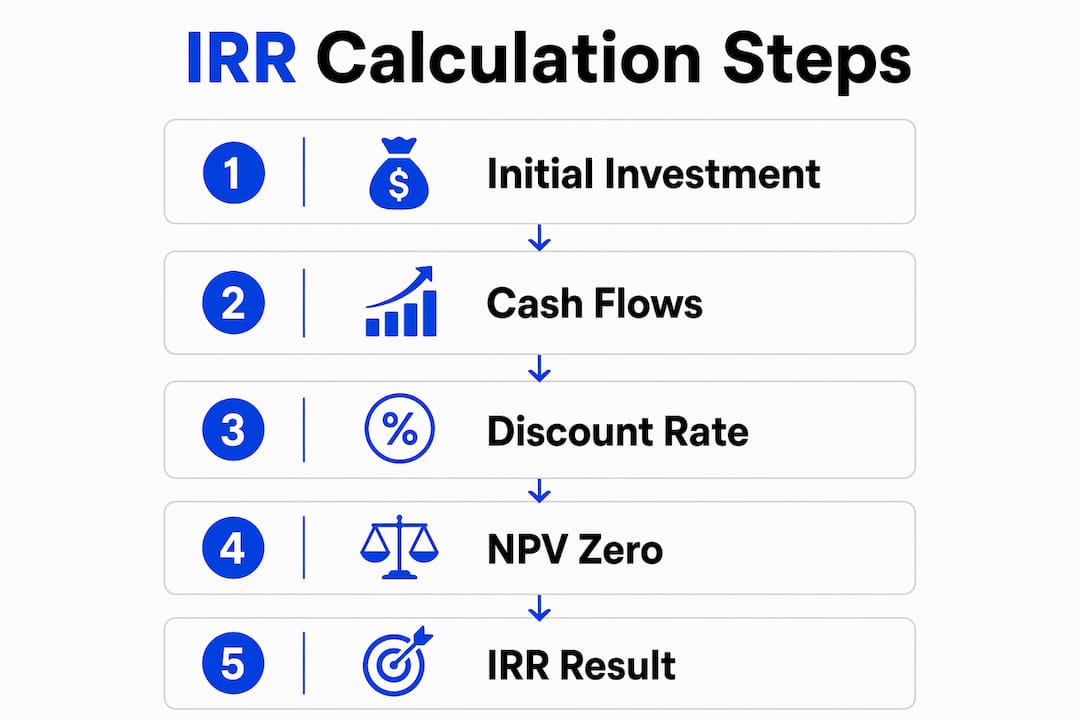
How the IRR formula works and why XIRR is the right tool
The IRR is defined by the equation that sets NPV to zero:
NPV = CF₀ + CF₁/(1+r) + CF₂/(1+r)² + … + CFₙ/(1+r)ⁿ = 0
Where:
CFₜ = cash flow in period t (negative for outflows, positive for inflows)
r = the IRR you are solving for
n = the total number of periods
There is no algebraic closed form for r when n is greater than two. Excel and Google Sheets solve it numerically through iteration, which is why you need a spreadsheet rather than a hand calculator.
Sign convention matters. Your initial equity check is a cash outflow, so it must be entered as a negative number. All distributions and the net sale proceeds are inflows, entered as positive numbers. Flip a sign and Excel returns a nonsense result or a #NUM! error.

IRR vs. XIRR. Excel’s =IRR() function assumes each period is exactly equal in length. Real estate closings, rent distributions, and sale proceeds rarely fall on perfect year-end anniversaries. XIRR accepts exact dates for each cash flow and computes the annualized return using actual day counts, which is why practitioners use it as the default.
MIRR as a conservative alternative. IRR implicitly assumes that every interim cash flow is reinvested at the IRR itself. On a high-returning deal, that assumption can overstate what you will actually earn. Modified internal rate of return (MIRR) lets you specify a separate reinvestment rate, typically your cost of capital or a conservative market rate, producing a more realistic return estimate. The reinvestment assumption is the single biggest practical gap between headline IRR and realized returns.
A step-by-step worked example: buy, hold, sell
Consider a straightforward five-year rental hold. You put in $100,000 of equity at closing, collect operating distributions each year, and sell at the end of Year 5.
Year | Cash Flow | Notes |
0 | ($100,000) | Equity at closing |
1 | — | Net operating distribution |
2 | — | Net operating distribution |
3 | — | Net operating distribution |
4 | — | Net operating distribution |
Running XIRR on this stream produces a positive IRR. The MOIC (equity multiple) is the total distributions and sale proceeds divided by the initial equity investment, illustrating total dollars returned relative to invested capital.
What this tells you. The exit dominates the IRR. The four years of operating distributions contribute relatively little to the annualized rate compared to the lump-sum sale. If your exit cap rate assumption is too optimistic, the IRR collapses quickly. The MOIC of 1.79x tells you the total dollars returned, which the IRR percentage alone cannot convey.
Pro Tip: Always split the final-year cash flow into operating income and net sale proceeds in separate rows before running XIRR. It makes it easy to stress-test the exit independently without rebuilding your entire cash-flow column.
For a deeper look at building the cash-flow inputs that feed this kind of model, the property cash flow guide from 2ndstreetpropertymanagement walks through each line item in detail.
How to calculate IRR in Excel and Google Sheets
Both Microsoft Excel and Google Sheets support IRR and XIRR. For real-world deals, always use XIRR.
Step-by-step cell layout:
In Column A, enter the date of each cash flow (e.g., A1: 01/15/2024, A2: 01/15/2025, and so on).
In Column B, enter the corresponding cash flow amounts. Year 0 must be negative.
In an empty cell, enter the XIRR formula.
Exact formulas:
=IRR(B1:B6) — use only when all cash flows are exactly one year apart
=XIRR(B1:B6, A1:A6) — preferred; uses actual dates for accurate day counts
=XIRR(B1:B6, A1:A6, 0.1) — the optional third argument is your initial guess (10% here); useful when Excel struggles to converge
Google Sheets supports both =IRR() and =XIRR() with identical syntax. Excel’s =IRR() expects evenly spaced periods; =XIRR() with date-stamped cash flows is the correct choice for irregular real estate timing.
Troubleshooting checklist:
#NUM! error: Usually a sign error. Check that Year 0 is negative and at least one later cash flow is positive.
All positive or all negative flows: IRR has no solution. You need at least one sign change.
Unexpected result: Add a guess argument (e.g., 0.15 for 15%) to steer the solver toward the right root.
Multiple sign changes: If cash flows go negative again mid-hold (a major renovation, for example), Excel may find multiple IRRs. Switch to MIRR or NPV analysis in that case.
Dates not recognized: Format Column A as dates, not text. In Excel, use the DATE() function if needed.
Pro Tip: Run =XIRR() and =MIRR() side by side in every deal memo. MIRR requires you to specify a finance rate and a reinvestment rate; using your cost of capital for both gives you a conservative floor on expected returns.
What is a good IRR, and how do you set a hurdle rate?
IRR benchmarks depend on strategy, leverage, and market conditions. Benchmark ranges commonly cited by practitioners:
Unlevered / all-cash rentals: 6–10% IRR
Levered stabilized rentals: 10–15% IRR
Value-add and BRRRR projects: 15–20%+ IRR (see the BRRRR strategy guide for current rate context)
Institutional LP targets: 13–18% over 5–7 year holds on certain strategies
A hurdle rate is the minimum IRR you will accept before committing capital. Experts advise always to compare a project’s IRR against a defined hurdle rate tied to the risk level of that specific strategy. In practice, set your hurdle at your cost of capital plus a risk premium. If your mortgage costs 7% and you require a 4% risk premium for the illiquidity and management burden of direct real estate, your hurdle is 11%.
A 15% IRR on a two-year flip and a 15% IRR on a seven-year hold are not equivalent opportunities. The flip returns your capital faster and lets you redeploy it; the hold ties it up longer. Always pair IRR with MOIC to see the full picture.
Pro Tip: Short hold periods inflate IRR mechanically. A deal that returns 1.3x equity in 18 months can show a 20%+ IRR even though the total dollars earned are modest. Always check MOIC alongside IRR to avoid confusing a fast return with a large one.
IRR’s common pitfalls and how to avoid them
IRR is a powerful metric, but it has real limitations that trip up novice investors.
Common pitfalls:
Reinvestment rate assumption: IRR assumes every distribution is reinvested at the IRR itself. On a 20% IRR deal, that is almost certainly unrealistic. MIRR corrects this by letting you set a separate, lower reinvestment rate.
Exit cap rate sensitivity: Because the sale dominates IRR, a small change in your exit cap rate assumption produces a large swing in IRR. A 0.5-point cap rate expansion on a $1M property can drop your IRR by 3–5 percentage points.
Multiple IRR problem: When cash flows change sign more than once (e.g., a large renovation cost mid-hold), the IRR equation can have multiple mathematical solutions. Excel will return one, but it may not be the economically meaningful one.
Scale blindness: A 22% IRR on a $50,000 deal returns less total cash than a 14% IRR on a $500,000 deal. IRR is a yield metric, not a wealth metric. Always show MOIC alongside it.
Meaningless when all flows are the same sign: If you never receive a positive cash flow (or never have a negative one), IRR has no solution.
MIRR as a practical fix. MIRR replaces the reinvestment assumption with an explicit rate you choose. In high-rate environments, the gap between IRR and MIRR can be meaningful. Practitioners often report both IRR and MIRR to provide a realistic range for expected returns, illustrating the impact of different reinvestment rate assumptions.
Practical mitigation steps:
Run sensitivity tables on exit cap rate (±0.5 and ±1.0 points)
Always show MOIC and total dollar profit alongside IRR in any deal memo
Standardize hold period and leverage assumptions across deals you are comparing
Pro Tip: When you see a projected IRR above 25%, the first question to ask is: what reinvestment rate is assumed? If the answer is “the IRR itself,” discount that number and run MIRR at your actual cost of capital.
How leverage and hold period shape your IRR
Leverage amplifies IRR by reducing the equity denominator. When you put $100,000 down instead of $400,000, the same property cash flows produce a much higher percentage return on your smaller equity base. That is the core mechanic.
Levered vs. unlevered IRR in words. Unlevered IRR treats the full property value as the investment and ignores financing. Levered IRR uses only your equity check as the investment and nets out debt service from cash flows. The difference between the two tells you how much value the financing structure adds or subtracts.
A quick numeric illustration. Suppose a property generates $40,000 in net cash flow over five years and sells for a $100,000 gain. Unlevered (all-cash, $400,000 purchase), your IRR might be around 8%. Levered (20% down, $80,000 equity), the same cash flows on a smaller equity base could push IRR above 15%, assuming the debt service leaves positive distributions. The financing structure did not change the property; it changed the return on your equity.
Trade-offs of higher levered IRR:
Higher headline IRR comes with higher default risk if cash flow dips below debt service
Refinancing risk: if rates rise at the end of a bridge loan, your refi proceeds shrink and IRR falls
Greater sensitivity to interest rate changes, particularly on variable-rate or short-term debt
Principal paydown and cash-out refinancing events feed IRR positively, but they also reset your risk exposure
Understanding how four return drivers interact with leverage is the foundation of any honest IRR analysis.
A practical checklist for using IRR alongside MOIC and cash-on-cash
No single metric tells the whole story. Here is a stepwise process for evaluating any deal:
Compute IRR using XIRR on the full cash-flow stream, including the projected exit.
Compute MOIC by dividing total cash returned by total equity invested.
Check cash-on-cash for each year of the hold to confirm the property generates acceptable annual yield. A cash-on-cash return guide explains how to benchmark this figure.
Run exit cap rate sensitivity at ±0.5 and ±1.0 points from your base assumption.
Confirm the dollar outcome meets your actual wealth goal, not just the percentage target.
Standardize assumptions (hold period, leverage, vacancy rate) across every deal you compare.
Metric | What it answers | What it misses |
IRR | Annualized return on equity, time-weighted | Scale; reinvestment assumption; pre-tax only |
MOIC | Total dollars returned per dollar invested | Timing; does not penalize slow returns |
Cash-on-cash | Annual cash yield on invested equity | Exit proceeds; appreciation; debt paydown |
Cap rate | First-year unleveraged income yield | Financing; hold-period dynamics; exit |
Use this table as a checklist, not a ranking. Each metric answers a different question, and a deal worth pursuing should pass a reasonable threshold on all four. For a comprehensive deal-analysis process, the rental property deal analysis framework from 2ndstreetpropertymanagement covers every component.
Four quick checks to triage a rental property before you model it
Before you build a full spreadsheet, four back-of-the-envelope checks can tell you whether a deal is worth the effort.
Check 1: Rough MOIC estimate
Estimate total cash returned (annual distributions × hold years + projected sale proceeds) and divide by your equity check. If the rough MOIC is below 1.5x on a five-year hold, the deal is unlikely to clear a 10–12% IRR hurdle without heroic assumptions.
Check 2: Quick cash-on-cash
Divide year-one net operating income minus debt service by your equity investment. If this number is below 5–6% on a stabilized rental, the property is either overpriced or the financing is too expensive. Cash flow goals vary by strategy, but a negative or near-zero cash-on-cash in Year 1 is a red flag unless you have a clear value-add plan.
Check 3: Exit cap rate sanity check
Look up current market cap rates for comparable properties in the submarket. If your projected exit requires a cap rate compression of more than 50 basis points from today’s market, build a downside scenario where the cap rate stays flat or expands. A deal that only works with cap rate compression is a bet on market timing, not a disciplined investment.
Check 4: Financing sensitivity
Recalculate your debt service at a rate 1.5 points higher than your current quote. If the deal turns cash-flow negative under that stress, your IRR depends on a rate environment you cannot control. This check is especially relevant for bridge loans and value-add projects where the refi is a key IRR driver.
A quick narrative example. A duplex lists at $320,000. You plan to put 25% down ($80,000 equity). Year-one net operating income after vacancy and expenses is $22,000; debt service at 7% on a 30-year loan is $17,100. Cash-on-cash: ($22,000 - $17,100) / $80,000 = 6.1%. Rough MOIC at five years assuming 3% annual appreciation: ($4,900 × 5 + $371,000 sale - $230,000 remaining loan) / $80,000 = approximately 2.0x. That passes both quick checks and warrants a full XIRR model.
At 2ndstreetpropertymanagement, this triage framework is the first filter we apply when reviewing opportunities for investor clients in Southern New Jersey. Operational improvements, including tighter vacancy management and vendor cost control, directly affect the cash-flow inputs that drive IRR.
Pro Tip: Flag any deal where the exit proceeds account for more than 80% of the projected IRR. That deal is not a rental investment; it is a bet on appreciation. Make sure your underwrite reflects that risk.
Key Takeaways
IRR is the most complete single-number return metric for real estate hold-period analysis, but it only tells the full story when paired with MOIC, cash-on-cash, and a sensitivity check on your exit assumptions.
Point | Details |
IRR definition | Annualized, time-weighted return on equity across all hold-period cash flows, including the exit. |
Use XIRR, not IRR | Excel’s =XIRR() uses actual dates; =IRR() assumes equal periods and distorts real-world results. |
Pair IRR with MOIC | A high IRR on a small deal can return less total cash than a lower IRR on a larger one. |
Know the pitfalls | Reinvestment assumption, exit cap rate sensitivity, and scale blindness are the three biggest IRR traps. |
2ndstreetpropertymanagement | Applies this IRR framework when evaluating rental opportunities for investor clients in Southern New Jersey. |
IRR should be a discipline, not just a number
Most investors treat IRR as the finish line. Run the model, see the percentage, make the call. That habit is where the mistakes happen.
The more useful discipline is to treat IRR as the starting point for three follow-up questions: What MOIC does this produce? What happens to the IRR if the exit cap rate moves 50 basis points against me? And is the reinvestment assumption embedded in this number realistic? When you run XIRR and MIRR side by side and show the MOIC in the same memo, you force yourself to answer all three. The gap between IRR and MIRR is not a technicality; it is a signal about how much of your projected return depends on reinvesting distributions at an aggressive rate.
The other habit worth building: set your hurdle rate before you look at any deal, not after. Investors who set the hurdle after seeing the projected IRR almost always find a reason to accept a number that would have failed a pre-set standard. Decide what your cost of capital is, add a risk premium for the strategy, and hold that line. A deal that clears 15% IRR with a 1.8x MOIC and positive cash-on-cash from Year 1 is a genuinely good deal. A deal that clears 15% IRR only because of an aggressive exit assumption and a two-year hold is a different animal entirely.
How 2ndstreetpropertymanagement helps investors protect their IRR
Every percentage point of IRR you project depends on cash flows that actually show up. Vacancy, deferred maintenance, and slow lease-up are the three fastest ways to erode a projected return before you ever reach the exit.

2ndstreetpropertymanagement is built by investors, for investors, with a focus on the operational details that protect hold-period returns: tenant screening that reduces vacancy, rent collection that keeps cash flows on schedule, and maintenance coordination that prevents small repairs from becoming capital events. For landlords and rental property owners in Southern New Jersey, those operational disciplines translate directly into the cash-flow inputs that drive your IRR model. If you want property management that treats your return metrics as seriously as you do, contact 2ndstreetpropertymanagement to discuss your portfolio.
Useful sources and tools for further reading
The sources below support the analysis in this article and provide additional depth on IRR theory, spreadsheet mechanics, and real estate return benchmarks.
Source | What it covers |
JPMorgan: What Is IRR in Commercial Real Estate? | Authoritative overview of IRR definition, hurdle rates, and practical use in CRE |
CapRateCity: IRR for Real Estate | Practitioner-focused explanation with benchmark ranges and MOIC comparison |
Apers: IRR Calculator and Formula | XIRR mechanics, MIRR comparison, and worked numeric examples |
Corporate Finance Institute: IRR | Theory, reinvestment assumption, and MIRR methodology |
PropertyScout: How to Calculate IRR | Step-by-step Excel and XIRR instructions with troubleshooting |
Additional tools and reading:
Microsoft Excel XIRR documentation: search “XIRR function” on support.microsoft.com for the official syntax reference and examples
Google Sheets XIRR: available natively with identical syntax to Excel’s XIRR function
Understanding real estate ROI in regional markets, with additional IRR and ROI context
2ndstreetpropertymanagement for property management services that support investor return goals in Southern New Jersey
Recommended
Comments